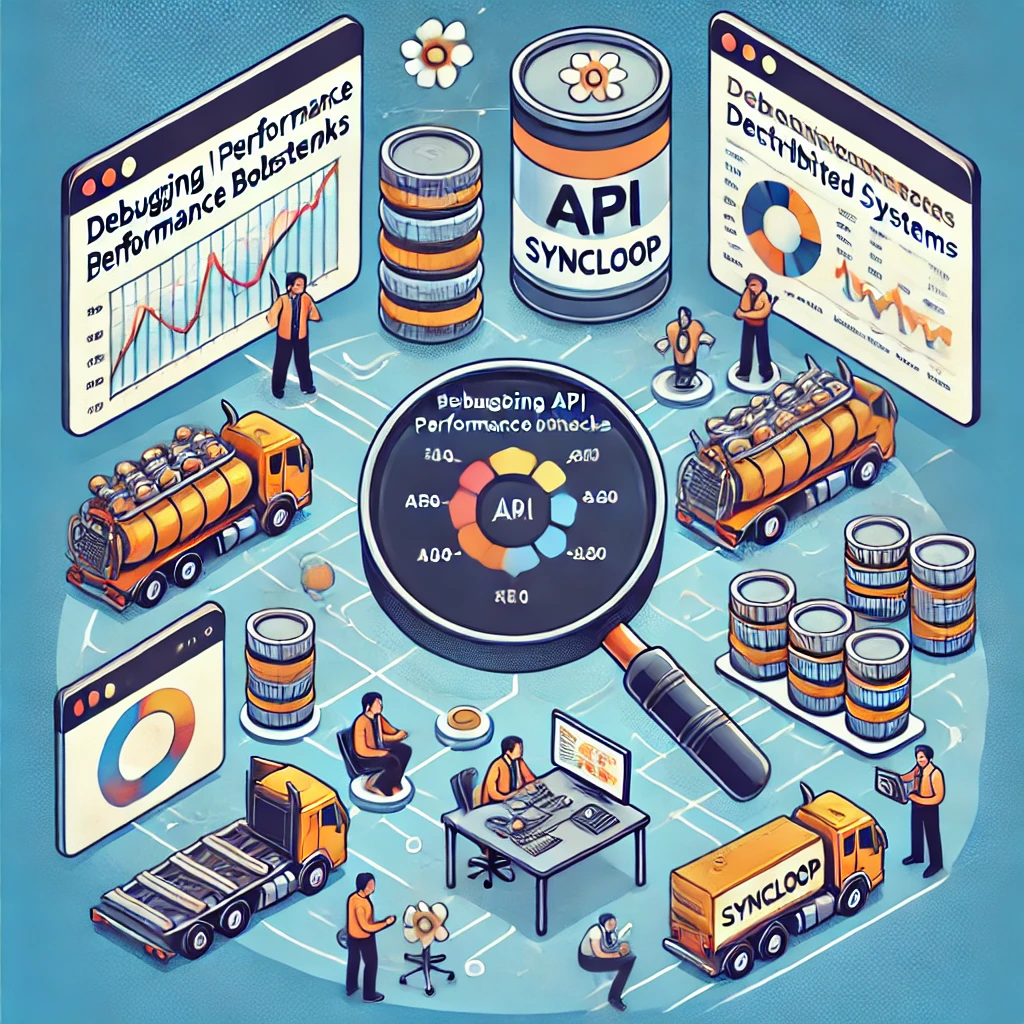
Debugging API Performance Bottlenecks in Distributed Systems with Syncloop

Syncloop provides powerful tools to identify, analyze, and resolve API performance bottlenecks in distributed systems. This blog explores common causes of API bottlenecks, how Syncloop simplifies debugging, and best practices for optimizing API performance in distributed environments.
What Are API Performance Bottlenecks?
API performance bottlenecks occur when the processing or response time of APIs becomes slower than expected, causing delays in the entire system. Common symptoms include:
- High Latency: Increased response times in API calls.
- Request Timeouts: APIs failing to respond within the stipulated time.
- Reduced Throughput: A drop in the number of successful requests handled per second.
- Resource Contention: Overloaded servers or databases impacting API performance.
Common Causes of API Bottlenecks in Distributed Systems
- Network Latency Delays in data transmission across services due to geographic or infrastructure issues.
- Overloaded Servers Insufficient compute resources to handle API traffic during peak loads.
- Inefficient Queries Slow database queries causing delays in API responses.
- Poorly Optimized Code Inefficient algorithms or redundant processing in API logic.
- Rate-Limiting and Throttling APIs hitting rate limits due to high request volumes, causing delays or failures.
- Dependency Failures Bottlenecks in third-party services or internal microservices affecting downstream APIs.
How Syncloop Helps Debug API Bottlenecks
Syncloop provides comprehensive tools and features to debug and resolve API performance issues:
- Real-Time Monitoring Visualize API traffic, response times, and error rates in real time.
- Detailed Logs Access request and response logs to identify delays and failures.
- Performance Analytics Analyze metrics like latency, throughput, and error rates to pinpoint bottlenecks.
- Distributed Tracing Trace API calls across multiple services to identify slow points in the request path.
- Load Testing Tools Simulate high traffic to evaluate API behavior under peak loads.
- Error Simulation Test APIs under simulated failure conditions to identify vulnerabilities.
- Dynamic Data Mapping Optimize data transformations to reduce processing overhead.
Steps to Debug API Bottlenecks with Syncloop
Step 1: Monitor API Traffic
Enable Syncloop’s real-time monitoring to observe API behavior. Focus on metrics such as:
- Average response time.
- Percentage of requests resulting in errors.
- Throughput (requests per second).
Step 2: Analyze Logs and Metrics
Review Syncloop’s detailed logs and analytics dashboards to identify:
- API endpoints with high latency.
- Request patterns causing resource contention.
- External service dependencies causing delays.
Step 3: Implement Distributed Tracing
Use Syncloop’s distributed tracing features to track API calls across services. Identify:
- Slow microservices in the call chain.
- Long-running database queries.
- Inefficient communication patterns.
Step 4: Perform Load Testing
Simulate traffic spikes using Syncloop’s load testing tools. Evaluate:
- API behavior under peak loads.
- Impact of rate-limiting and throttling policies.
- Scalability of infrastructure.
Step 5: Optimize API Logic
Refactor API code or logic based on insights gained. Common improvements include:
- Caching frequently accessed data.
- Optimizing database queries.
- Reducing payload sizes for API responses.
Step 6: Test and Deploy
Test the optimized APIs in a staging environment before deploying changes to production. Use Syncloop’s error simulation tools to verify reliability under various conditions.
Step 7: Monitor Continuously
Continue monitoring API performance post-deployment to ensure issues are resolved and do not recur.
Best Practices for API Performance Optimization
- Use Asynchronous Processing Offload non-critical tasks to asynchronous processes to reduce API response times.
- Implement Caching Cache frequently requested data at the server or client level to reduce processing overhead.
- Optimize Database Access Use indexed queries, avoid N+1 queries, and minimize database locks.
- Adopt Rate Limiting and Throttling Protect APIs from abuse while ensuring fair resource allocation during high traffic.
- Implement Load Balancing Distribute API traffic across multiple servers to prevent overloading.
- Use Compression Compress API responses to reduce data transfer times.
- Document API Dependencies Clearly define and monitor dependencies to reduce cascading failures.
Example Use Case: E-Commerce Platform
An e-commerce platform experiences slow response times during flash sales. Syncloop resolves this by:
- Monitoring Traffic: Identifying spikes in API latency and error rates.
- Tracing Dependencies: Pinpointing slow database queries and overloaded microservices.
- Optimizing Code: Implementing caching for product catalog queries and reducing payload sizes.
- Load Testing: Simulating traffic to ensure APIs handle peak loads effectively.
- Continuous Monitoring: Using real-time dashboards to track performance improvements.
Benefits of Using Syncloop for API Bottleneck Debugging
- Faster Issue Resolution: Identify and resolve performance issues quickly with detailed insights.
- Improved Reliability: Ensure consistent API performance under varying loads.
- Enhanced Scalability: Optimize APIs to handle growth in traffic and data volume.
- Actionable Insights: Gain visibility into API behavior with real-time analytics and distributed tracing.
- Reduced Downtime: Minimize disruptions by proactively addressing bottlenecks.
The Future of API Performance Management
As distributed systems grow in complexity, ensuring optimal API performance will require advanced tools and proactive strategies. Syncloop equips developers with the capabilities needed to debug and optimize APIs, enabling seamless, high-performing applications in diverse environments.
Image Description
A conceptual graphic illustrating API performance debugging in distributed systems using Syncloop. The image highlights real-time monitoring, distributed tracing, and analytics tools pinpointing bottlenecks in a multi-service environment.
Back to Blogs