Designing APIs for Retail Analytics Dashboards with Syncloop

Syncloop provides a robust platform for designing APIs tailored to retail analytics dashboards, ensuring scalability, security, and performance. This blog explores how Syncloop facilitates API development for retail analytics and offers best practices for implementing efficient and reliable solutions.
The Role of APIs in Retail Analytics Dashboards
APIs are integral to retail analytics dashboards, enabling:
- Data Integration: Aggregating data from multiple sources such as POS systems, CRM platforms, and inventory databases.
- Real-Time Analytics: Delivering live updates on sales, stock levels, and customer metrics.
- Customizable Visualizations: Supporting dynamic queries to populate graphs, charts, and tables.
- Workflow Automation: Automating processes like report generation and trend analysis.
- Scalability: Handling growing volumes of data and user requests without performance degradation.
Challenges in Designing Retail Analytics APIs
- Data Volume Processing and aggregating large datasets in real time.
- Integration Complexity Connecting diverse data sources with varying formats and protocols.
- Performance Ensuring low latency and high throughput for real-time dashboard updates.
- Security and Compliance Protecting sensitive customer and business data while adhering to regulations.
- Customizability Supporting diverse query requirements for different analytics views.
How Syncloop Simplifies API Development for Retail Analytics Dashboards
Syncloop provides tools and features tailored for retail analytics APIs:
- Dynamic Data Mapping Transform and normalize data from multiple sources for seamless integration.
- Real-Time Processing Handle high-throughput data streams with low-latency processing.
- Workflow Automation Automate data collection, aggregation, and reporting processes.
- Advanced Security Features Implement role-based access control (RBAC), encryption, and secure authentication.
- Monitoring and Analytics Track API performance and identify bottlenecks with real-time dashboards.
- Scalable Infrastructure Handle increasing data volumes and user requests efficiently.
- Custom Query Support Enable dynamic query generation for tailored analytics and visualizations.
Steps to Design Retail Analytics APIs with Syncloop
Step 1: Identify Key Metrics and Data Sources
Define the metrics to be displayed on the dashboard, such as:
- Sales trends and revenue breakdowns.
- Inventory levels and restocking needs.
- Customer engagement metrics like repeat purchases and loyalty points.
Identify the data sources, including:
- Point-of-sale (POS) systems.
- Inventory management software.
- Customer relationship management (CRM) platforms.
Step 2: Integrate Data Sources
Use Syncloop’s data integration tools to connect APIs with:
- Relational and NoSQL databases.
- Third-party APIs for e-commerce or marketing analytics.
- IoT devices, such as in-store foot traffic sensors.
Step 3: Design API Endpoints
Create endpoints for dashboard functionalities, such as:
- /sales/summary: Fetch sales metrics for a given period.
- /inventory/status: Provide stock levels and reorder alerts.
- /customer/insights: Deliver engagement metrics and loyalty trends.
Step 4: Implement Real-Time Updates
Enable real-time data flow using Syncloop’s event-driven architecture. For example:
- Trigger updates to sales data when new transactions are recorded.
- Notify inventory managers of low stock in real time.
- Provide live customer insights during promotional campaigns.
Step 5: Ensure Security and Compliance
Leverage Syncloop’s security features to protect sensitive data. Ensure:
- Data encryption during transmission and at rest.
- Secure authentication for API access.
- Compliance with regulations such as GDPR or CCPA.
Step 6: Test and Monitor APIs
Simulate dashboard interactions using Syncloop’s testing tools. Validate:
- Latency and response times for API requests.
- Accuracy of aggregated data.
- Resilience under peak traffic conditions.
Use Syncloop’s monitoring tools to track API performance post-deployment.
Best Practices for Retail Analytics APIs
- Design for Scalability Use scalable infrastructure to handle spikes in traffic and data processing.
- Optimize Data Queries Implement caching and indexing to improve query performance.
- Enable Customization Allow users to tailor dashboard views with dynamic query parameters.
- Implement Role-Based Access Restrict access to sensitive data based on user roles and permissions.
- Provide Comprehensive Documentation Include clear guidelines for integrating and using the APIs.
Example Use Case: Multi-Store Retail Chain Dashboard
A retail chain uses Syncloop to build APIs for a centralized analytics dashboard:
- Sales Metrics: APIs aggregate sales data from individual stores and generate performance comparisons.
- Inventory Tracking: Real-time APIs alert store managers about low stock levels and restocking schedules.
- Customer Insights: APIs provide loyalty trends and engagement metrics for targeted marketing campaigns.
- Monitoring and Optimization: Syncloop tracks API usage and identifies slow queries for optimization.
Benefits of Using Syncloop for Retail Analytics APIs
- Improved Efficiency: Automate data aggregation and processing for faster insights.
- Real-Time Insights: Deliver up-to-date metrics to drive timely decisions.
- Enhanced Scalability: Support growing data volumes and user demands seamlessly.
- Robust Security: Protect sensitive data and ensure regulatory compliance.
- Customizable Dashboards: Enable tailored views for diverse user needs.
The Future of Retail Analytics
As the retail industry becomes more data-driven, robust APIs will be critical for delivering actionable insights and optimizing operations. Syncloop equips developers with the tools needed to build scalable, secure, and efficient APIs for modern retail analytics dashboards.
Image Description
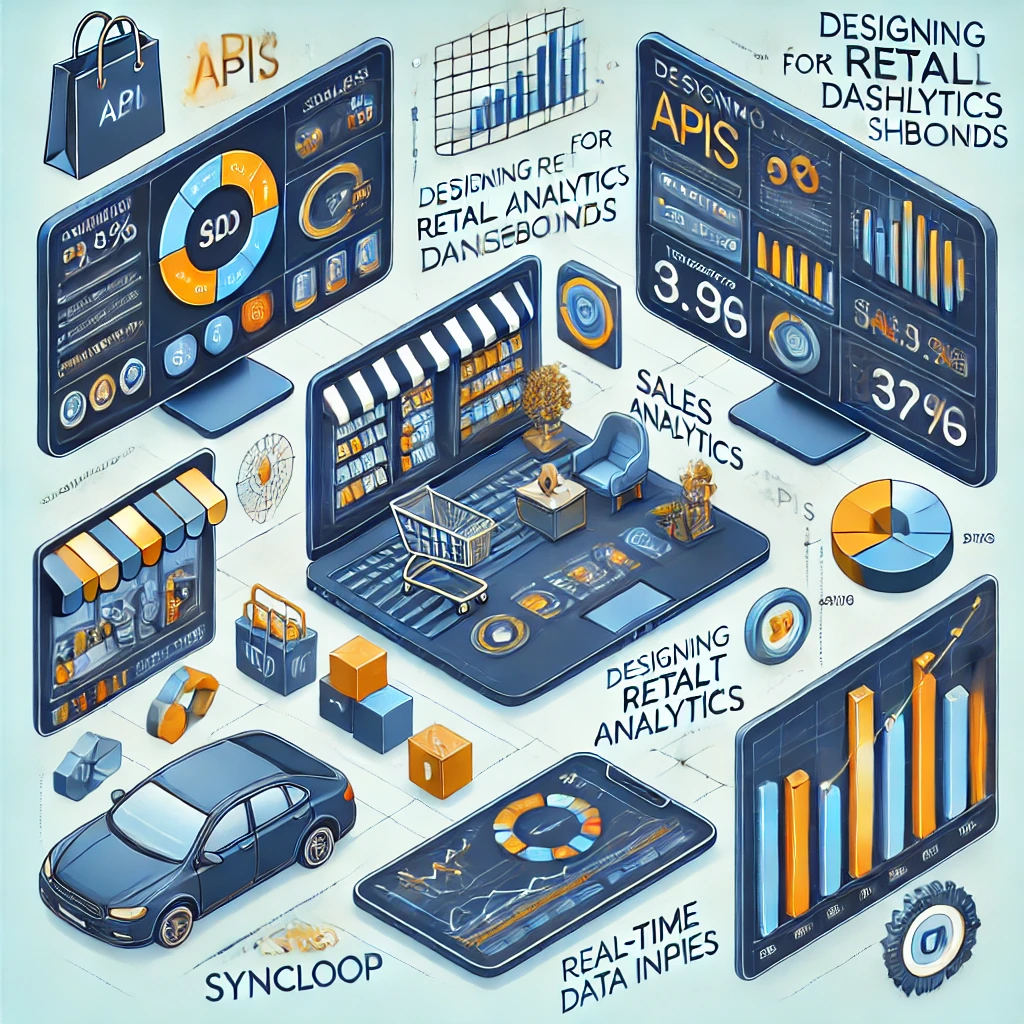
A conceptual illustration of retail analytics dashboards powered by Syncloop, featuring real-time metrics, dynamic data integration, and customizable visualizations. The image highlights seamless API workflows and robust security features.
Back to Blogs