Monitoring and Analytics for Syncloop APIs: Making Data-Driven Decisions
Posted by: Muheet | September 28, 2024

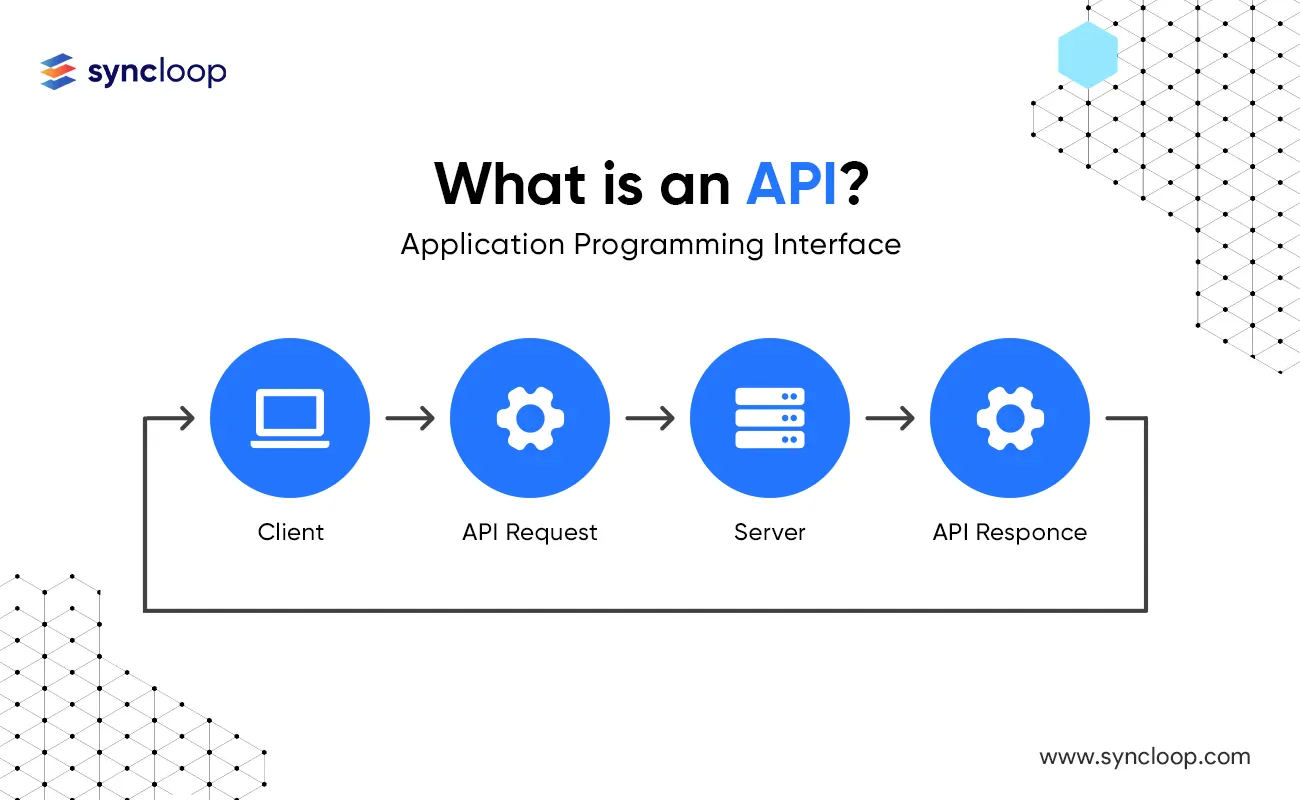
In today’s digital era, APIs (Application Programming Interfaces) form the backbone of many software applications, enabling seamless communication and data exchange between different systems. Syncloop, a comprehensive API management platform, provides all the tools to create, deploy, and manage APIs. However, robust monitoring and analytics are crucial to maximise the efficiency and effectiveness of these APIs. This blog will explore how you can implement monitoring and analytics for APIs built on Syncloop to gain meaningful insights into their usage and performance. These insights can help make informed, data-driven decisions and optimise API performance.
The Importance of Monitoring and Analytics
Before diving into the specifics of monitoring and analytics for Syncloop APIs, let's briefly discuss why these practices are essential.
- Performance Optimization: Tracking key metrics like response times and error rates helps identify bottlenecks and improve API performance, ensuring they remain fast and reliable.
- Usage Insights: Analyzing API usage provides insights into user behavior and preferences, which can guide product development and better tailor services.
- Error Detection and Troubleshooting: Continuous monitoring helps in early detection of errors, minimizing downtime by quickly identifying and resolving issues.
- Security Monitoring: Monitoring can detect unusual activity or security breaches, allowing you to take immediate action to protect your APIs.
- Scalability and Resource Management: Monitoring helps understand load patterns, assisting in resource planning and ensuring scalability for peak usage periods.
Implementing Monitoring and Analytics for Syncloop APIs
Here’s a step-by-step guide to implementing effective monitoring and analytics for APIs using Syncloop:
1. Set Up Performance Metrics
Identify key performance indicators (KPIs) to monitor:
- Response Time: Measure how quickly your API responds to requests.
- Error Rate: Track failed API calls to identify issues.
- Throughput: Monitor the volume of API requests over time.
- Latency: Measure the time delay between the request and response.
- Concurrency: Track the number of concurrent API calls.
2. Use Syncloop's Built-in Monitoring Tools
Syncloop offers built-in tools for real-time monitoring. Here’s how to use them:
- Step 1: Navigate to the Syncloop dashboard.
- Step 2: Select the API you want to monitor.
- Step 3: Go to the "Monitoring" section to view real-time metrics like response time and error rates.
3. Implement Logging
Logging API interactions is essential for troubleshooting.
- Step 1: Enable API logging in Syncloop.
- Step 2: Define the required logging level, such as status codes, response times, or full request/response logs.
- Step 3: Use log management tools like ELK Stack (Elasticsearch, Logstash, Kibana) for storing and visualizing logs.
4. Integrate with Third-Party Monitoring Tools
For advanced analytics, consider integrating Syncloop with tools like Prometheus and Grafana:
- Step 1: Set up a Prometheus exporter to collect metrics.
- Step 2: Configure Prometheus to scrape the metrics.
- Step 3: Integrate with Grafana for visualizations and dashboards.
5. User Interaction Analytics
Gathering data on API usage helps you understand user behavior.
- Step 1: Track API usage patterns, such as peak times and commonly accessed endpoints.
- Step 2: Use platforms like Google Analytics or Mixpanel for deeper insights.
- Step 3: Generate reports and dashboards summarizing user interaction data.
6. Set Up Alerts and Notifications
Proactive monitoring involves setting up alerts for key metrics.
- Step 1: Define thresholds for KPIs like response time and error rates.
- Step 2: Configure alerts within Syncloop or integrate with third-party tools for email or SMS notifications.
- Step 3: Test alert functionality to ensure timely responses.
7. Analyzing Historical Data
Tracking historical performance helps you plan for the future.
- Step 1: Store historical data in a time-series database like InfluxDB.
- Step 2: Use data visualization tools to create historical performance dashboards.
- Step 3: Analyze trends to plan for scalability and optimize performance.
8. Security Monitoring
API security is paramount. Implement monitoring to detect potential threats.
- Step 1: Enable logging of security events, such as failed authentication attempts.
- Step 2: Use SIEM (Security Information and Event Management) tools to analyze logs for suspicious activity.
- Step 3: Set up alerts for security anomalies like multiple failed logins or unexpected access.
Conclusion
In conclusion, robust monitoring and analytics are essential for managing and optimising Syncloop APIs. By setting up comprehensive monitoring for performance metrics, implementing logging, integrating with advanced analytics tools, analysing user interactions, and ensuring security monitoring, you can gain valuable insights into API usage and performance. These insights enable data-driven decision-making, helping optimise performance, error detection, security enhancement, and resource management.
Effective monitoring and analytics empower organisations to maintain high API performance, ensure reliability, and provide a superior user experience, ultimately contributing to the overall success of their digital initiatives.
Back to Blogs

